Project controls are subtopic C of Construction Engineering on the FE Civil exam: scheduling with activity networks, and tracking cost and progress with earned value. Once the network or the three earned value numbers are laid out, the questions are arithmetic.
The five problems below find a project's duration and an activity's total float from activity-on-node networks, compute CPI and SPI, estimate the cost at completion, and take an expected duration from PERT times.
Where this sits: NCEES lists Construction Engineering at 8-12 questions of the 110 on the FE Civil exam, and project controls (e.g., earned value, scheduling, allocation of resources, activity relationships) is subtopic C of the area. NCEES does not publish question counts below that level.
The Scheduling and Earned Value Relationships These Problems Use
The FE Reference Handbook lists the earned value formulas; early and late starts and finishes come from a forward and a backward pass through the network.
- Project duration: the longest path through the network, the critical path
- Total float: \( TF = LS - ES = LF - EF \)
- Performance indices: \( CPI = EV/AC \) and \( SPI = EV/PV \)
- Estimate at completion, current efficiency continuing: \( EAC = BAC/CPI \)
- PERT expected time: \( t_e = \dfrac{a + 4m + b}{6} \)
5 Free Critical Path and Earned Value Problems
Give yourself about three minutes for each one, roughly the pace of the exam, and work it on paper before you look at the solution.
Problem 1 — PERT Expected Time
An activity has PERT times: optimistic \( a = 4 \,\mathrm{days} \), most likely \( m = 6 \,\mathrm{days} \), pessimistic \( b = 10 \,\mathrm{days} \). What is the expected time \( t_e \) (\( \mathrm{days} \)), nearest \( 0.01 \)?
Answer: A) \( 6.33 \)
Step 1 – Identify given information: Optimistic \( a = 4 \;\text{days} \), most likely \( m = 6 \;\text{days} \), pessimistic \( b = 10 \;\text{days} \).
Step 2 – PERT expected time formula: The PERT method uses a weighted average with the most likely estimate weighted 4 times:
$$t_e = \dfrac{a + 4m + b}{6}$$
Step 3 – Substitute and solve:
$$t_e = \dfrac{4 + 4(6) + 10}{6} = \dfrac{4 + 24 + 10}{6} = \dfrac{38}{6} = 6.33 \;\text{days}$$
Step 4 – Answer: \( t_e = 6.33 \;\text{days} \). The expected time is slightly above the most likely time (6 days) because the pessimistic estimate (10) is farther from the mode than the optimistic (4), creating positive skew.
Correct answer: (A)
Option (C) comes from hanging the factor of 4 on the pessimistic time instead of the most likely one: \((4 + 4(10) + 6)/6 = 8.33\) days. Option (D) forms the right numerator, 38, but divides it by the mode's weight of 4 rather than by the sum of the weights, 6.
Problem 2 — CPI and SPI
A project has \( PV = \$180{,}000 \), \( EV = \$150{,}000 \), \( AC = \$165{,}000 \). What are \( CPI \) and \( SPI \) (nearest \( 0.01 \))?
Answer: B) \( CPI = 0.91,\; SPI = 0.83 \)
Step 1 – Identify the Earned Value Management (EVM) data:
| Metric | Value | Meaning |
|---|---|---|
| \( PV \) (Planned Value) | \( \$180{,}000 \) | Budgeted cost of work scheduled |
| \( EV \) (Earned Value) | \( \$150{,}000 \) | Budgeted cost of work performed |
| \( AC \) (Actual Cost) | \( \$165{,}000 \) | Actual cost of work performed |
Step 2 – Calculate the Cost Performance Index (CPI):
$$CPI = \frac{EV}{AC} = \frac{150{,}000}{165{,}000} = 0.909 \approx 0.91$$
Interpretation: CPI < 1.0 means the project is over budget — for every \( \$1 \) spent, only \( \$0.91 \) of value was earned.
Step 3 – Calculate the Schedule Performance Index (SPI):
$$SPI = \frac{EV}{PV} = \frac{150{,}000}{180{,}000} = 0.833 \approx 0.83$$
Interpretation: SPI < 1.0 means the project is behind schedule — only 83% of the planned work has been completed.
Step 4 – Summary of EVM index interpretation:
| Index | < 1.0 | = 1.0 | > 1.0 |
|---|---|---|---|
| CPI | Over budget | On budget | Under budget |
| SPI | Behind schedule | On schedule | Ahead of schedule |
Correct answer: (B)
Problem 3 — Estimate at Completion
\( BAC = \$900{,}000 \) and current \( CPI = 0.80 \). Estimate \( EAC \) using \( EAC = BAC/CPI \) (\( \mathrm{USD} \)).
Answer: C) \( \$1{,}125{,}000 \)
Step 1 – Identify given information:
| Parameter | Value |
|---|---|
| \( BAC \) (Budget at Completion) | \( \$900{,}000 \) |
| \( CPI \) (Cost Performance Index) | \( 0.80 \) |
Step 2 – Estimate at Completion (EAC) formula: Assuming current cost performance continues for the remainder of the project:
$$EAC = \dfrac{BAC}{CPI}$$
Step 3 – Solve:
\( EAC = \dfrac{900{,}000}{0.80} = \$1{,}125{,}000 \)
Step 4 – Answer: The correct answer is (C) \(\$1{,}125{,}000\). Since \( CPI = 0.80 < 1.0 \), the project is over budget, and if the trend continues, the final cost will be \( 25\% \) higher than the original budget. Option A assumes perfect cost performance (\( CPI = 1.0 \)). This EAC formula is the most commonly used when past performance is expected to continue.
Problem 4 — Project Duration from a Network
An AON network (days): \( A(3) \) and \( B(4) \) start. \( C(6) \) after A. \( D(5) \) after A. \( E(2) \) after B and C. \( F(7) \) after D. \( G(3) \) after E and F. What is the project duration (days)?

Answer: B) \( 18 \) days
Step 1 – Identify given information:
| Activity | Duration | Predecessors |
|---|---|---|
| A | \( 3 \) days | Start |
| B | \( 4 \) days | Start |
| C | \( 6 \) days | A |
| D | \( 5 \) days | A |
| E | \( 2 \) days | B, C |
| F | \( 7 \) days | D |
| G | \( 3 \) days | E, F |
Step 2 – Critical Path Method (CPM): The project duration equals the length of the longest (critical) path through the network.
Step 3 – Solve: Evaluate all paths from start to finish:
$$A \to D \to F \to G = 3 + 5 + 7 + 3 = 18 \text{ days}$$
$$A \to C \to E \to G = 3 + 6 + 2 + 3 = 14 \text{ days}$$
$$B \to E \to G = 4 + 2 + 3 = 9 \text{ days}$$
The longest path is \( A \to D \to F \to G = 18 \) days.
Step 4 – Answer: The correct answer is (B) 18 days. The critical path \( A \to D \to F \to G \) controls the project duration. Any delay on these activities directly delays the project completion.
Option (D) is what you get by running the two activities that both follow A back-to-back instead of side by side. That drags the non-critical 6-day branch onto the critical chain and adds 6 days to the true 18-day duration.
Problem 5 — Total Float of an Activity
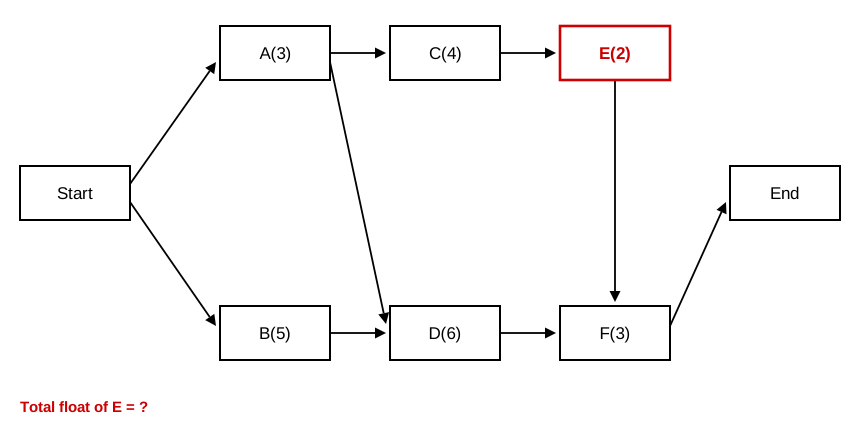
An AON network is: A(\( 3 \)) start; B(\( 5 \)) start; C(\( 4 \)) after A; D(\( 6 \)) after A and B; E(\( 2 \)) after C; F(\( 3 \)) after D and E. What is the total float of activity E (\( \mathrm{days} \))?
Answer: A) \( 2 \)
Step 1 – Identify given information:
AON: A(3), B(5) start; C(4) after A; D(6) after A and B; E(2) after C; F(3) after D and E. Find the total float of E.
Step 2 – Forward pass (ES → EF):
A: 0→3 • B: 0→5 • C: 3→7 • D: max(3, 5) = 5→11 • E: 7→9 • F: max(11, 9) = 11→14
Step 3 – Backward pass through E:
Duration 14 (critical path B–D–F). \( LS_F = 14 - 3 = 11 \Rightarrow LF_E = 11 \Rightarrow LS_E = 11 - 2 = 9 \)
Step 4 – Total float:
$$TF_E = LS_E - ES_E = 9 - 7 = 2 \;\text{days}$$
Correct answer: (A)
Both larger options come from real CPM slips that inflate the float. Option (C) omits the successor's duration in the backward pass, using F's late finish (14) as E's late finish. Option (D) adds the individual total floats of A, C and E (\(2 + 2 + 2\)) as if each activity had its own slack, when the whole path shares a single 2-day float.
Three Mistakes That Cost Points
- Taking the shortest path. Every path must finish, so the project lasts as long as its longest path. The shorter paths are where the float is.
- Swapping CPI and SPI. Both have earned value on top. CPI divides by actual cost, SPI by planned value; an index below 1 means over budget or behind schedule.
- Missing the merge at a node with two predecessors. An activity starts only after all its predecessors finish, so its early start is the largest early finish among them. Taking the smaller one makes the schedule too short.
Frequently Asked Questions
What is the difference between total float and free float?
Total float is how long an activity can slip without delaying the project. Free float is how long it can slip without delaying the early start of any activity that follows it. Activities on the critical path have zero total float.
What does a CPI of 0.80 mean?
The project earns 80 cents of planned work for every dollar it spends. If that efficiency holds, the final cost will be the budget divided by 0.80, a quarter more than planned.
Where does the PERT weighting come from?
PERT treats each duration as a beta distribution, approximated by weighting the most likely time four times and the optimistic and pessimistic times once each. The standard deviation is (b minus a) over 6.
Keep Going
Practice the rest of the area on the FE Civil construction engineering practice problems page. To see these topics mixed with the other 13 areas, take the free FE Civil practice exam, or browse every topic in the free FE Civil practice problems hub.